

Ticker Take: a weekly newsletter on investing.
Why is the stock market sinking?

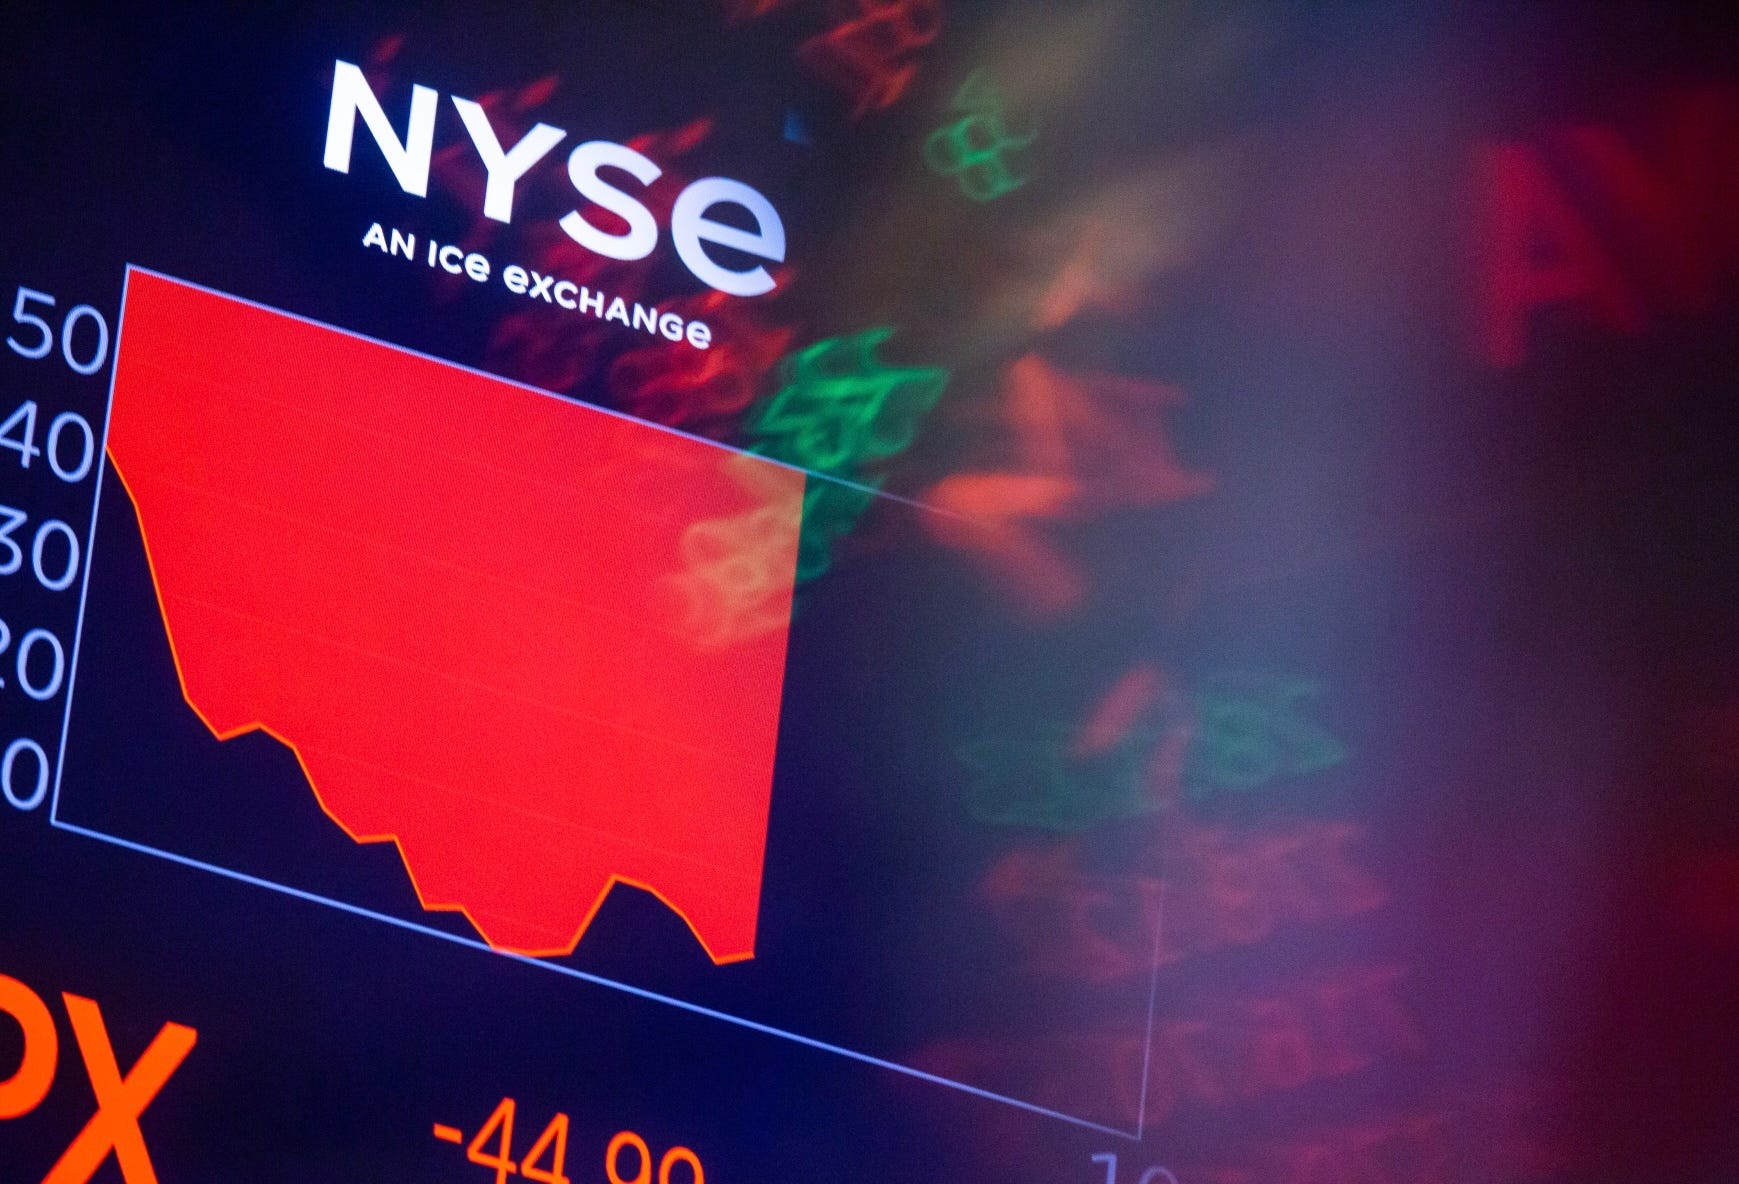
What just happened in the stock market?
After a bull market run that had very few pause points, investors have decided to hit the panic button. While there’s been an identified catalyst for the global selloff — which we’ll discuss further down — in many ways, the worries started weeks ago.
Let’s start with China’s economy.
Evidence of weaker growth in that market had already taken a bite out of commodity prices for oil and copper.
Meanwhile, investors had already started to shift out of the highest flying tech stocks.
For example, Nvidia’s peak valuation (so far) came and went more than six weeks ago.
Readers of this newsletter will recall I have previously shared the views of some investors who felt it was time to take profits on Nvidia.
And during earnings season so far, companies such as Alphabet, Meta and Amazon have found themselves trying to justify their AI spending bills to increasingly impatient investors.
On top of all that, news that new Nvidia chips are being delayed and Warren Buffett’s Berkshire Hathaway has sold a bunch of Apple stock is not helping sentiment.
Meanwhile, we’ve seen a fresh assessment on the health of the American consumer.
While the higher interest rate environment has been a real drag on countries such as Canada, there was a previous narrative suggesting the U.S. was still chugging along.
“Resilient” was a commonly cited word used to describe the economy.
It was suggested that many Americans weren’t feeling the change in rates as much because they had locked in their 30-year mortgages and remained confident spenders, especially since the jobs market seemed to be in relatively good shape.
But by Friday, a growing number of market participants were souring on that view, after a disappointing employment report.
So on the one hand, it appeared as if investors were getting closer to what they’ve what they’ve long desired — for the U.S. Federal Reserve to start cutting interest rates.
But on the other hand, there was now a fear the Fed would be cutting rates into a recessionary environment, rather than the previously hoped for “soft landing.”
In other words, investors were concerned the Fed changed course on rates too slowly and the economy was now in trouble.
That sparked fears corporate profits would be impacted and Wall Street would be forced to lower earnings expectations, which are a key variable in determining a stock’s valuation.
And finally, that brings us to what appears to be the main catalyst for the global selloff — the unwinding of the yen carry trade.
A carry trade is when an investor borrows the currency of a place where interest rates are low, like Japan, and uses the funds to invest in a currency where rates are higher, like Mexico.
The success of that trade depends on the borrowing currency staying cheap and volatility staying low. Instead, the yen surge and investors were forced to close their positions.
And it’s all happening in what can feel like a chaotic “head for the exits” moment.
So where does that leave us?
Well, let’s start with the unwinding of the yen carry trade.
First, you have to ask… does this development carry the same systemic risk that we saw, for example, during the Great Financial Crisis?
While I’d never try to stand in the way of a Black Swan, it’s worth pointing out that foreign bank borrowing in yen has collapsed since 2008, which is one of the reasons why some experts believe contagion from the FX market to the banking system is limited.
Meanwhile, one of our good friends, Karl Schamotta of Corpay said in a note that he believes the carry trade unwind should lose momentum in the coming days, as the most dangerous exposures are covered.
Another friend, Ed Yardeni of Yardeni Research told Bloomberg Television “I think we’ve overdone it.”
“This is very reminiscent so far of 1987 when we had a crash in the stock market that basically all occurred one day. The implication was that we were in or about to fall into a recession and that didn’t happen at all,” Yardeni said.
“I think a lot of this selloff has to do with this carry trade unwind. It’s conceivable that it could feed on itself…but I don’t think so. I think the U.S. economy is still growing and I think this will turn out to be a technical aberration in the market rather than something that turns into a recession.”
What happens to stocks when the Fed cuts interest rates?
We’ve talked about this theme many times before, but I thought I would bring back some analysis which is quite helpful in a moment like this.
Let’s first establish the fact that we now seem much closer to a Fed rate cut than we’ve been at any point in the cycle so far.
With that said, Duncan Lamont of Schroders has done some past work on what happens to U.S. stocks in the 12 month period after the Fed starts cutting rates.
In reviewing 22 rate cutting cycles since 1928, Lamont found that on average, the stock market rose 11% in the year following the first rate cut. That performance easily beat the average 12 month return for government and corporate bonds (and definitely trounced cash).
Also worth noting, in 16 of 22 of those rate cutting cycles, the U.S. was either already in a recession when the cuts started or entered one within those 12 months.
Returns in those recession scenarios were not as good — an 8% return, on average, compared to 17% in non-recessionary rate cutting cycles. But again, that 8% return beats both bonds and cash.
How long can bull markets last?
Even with all of the market carnage we’re seeing, history would still suggest we’re far from the end of this bull market.
Since 1928, there were 24 bull markets before this current one. Recall the S&P bottomed out in 2022, so we are now more than 660 days into the current bull market.
That is basically 22 months. Is that longer than some of the previous bull markets? Absolutely, but in more recent years – and specifically, with the past dozen or so bull markets – they have tended to run longer…in some cases, much longer.
That has pulled up the average bull market length to more than 1,000 days. That’s more than 33 months.
LENGTH OF BULL MARKETS SINCE 1928
1928: 452 days
1929: 148 days
1932: 98 days
1933: 141 days
1933: 108 days
1935: 389 days
1936: 311 days
1938: 223 days
1939: 200 days
1940: 152 days
1942: 442 days
1943: 912 days
1946: 615 days
1949: 2,607 days
1957: 1,512 days
1962: 1,324 days
1966: 784 days
1970: 961 days
1974: 2,248 days
1982: 1,839 days
1987: 4,494 days
2002: 1,826 days
2009: 3,999 days
2020: 651 days
2022: 663 days (so far)
Average since 1928: 1,012 days
Stocks that pay monthly dividends
We wanted to look at companies that pay monthly dividends. Normally, dividend payers distribute payouts on a quarterly basis. But if you’re looking for income sources to offset your living costs — which you might be budgeting more on a monthly basis, some investors seek out dividend payers that issue income each month. Now, to be clear — these names are not the most highly ranked stocks on the street. Some of them have less favorable analyst ratings. And just because a company pays a monthly dividend doesn’t qualify it as the best dividend play in the market. But since some of you have been curious about monthly payers, we’ve compiled a list. Our main criteria was based on the size of the payout. We looked for names that, per stock or per unit, pay at least 8 cents a month. What you end up with is a list of companies that is overwhelmingly skewed to the real estate market, where the REIT format often leads to steady income payouts. Here’s a closer look at the names in the spotlight…
STAG Industrial
EPR Properties
Realty Income
AGNC Investment
Gladstone Commercial
LTC Properties
Dynex Capital
Main Street Capital
Agree Realty
Canadian Apartment Properties REIT
Ellington Credit
Apple Hospitality REIT
US Global Investors
Paramount Resources
RioCan REIT
SL Green Realty
Armour Residential REIT
First National Financial
Freehold Royalties
CT Real Estate
Stellus Capital
Boston Pizza Royalties Income Fund
Exchange Income Corp
Bridgemarq Real Estate Services
Smartcentres REIT
Sienna Senior Living
Picks of the week
Tyler Ellegard, Gradient Investments: McDonald’s, Coca-Cola, Suncor
Ryan Bushell, Newhaven Asset Management: Pembina Pipeline, Arc Resources, K-Bro Linen
Greg Newman, ScotiaMcLeod: Boeing, Disney, Citigroup
Keith Richards, ValueTrend Wealth Management: iShares 20+ Year Treasury Bond ETF, iShares MSCI Brazil ETF, Atkinsrealis Group
Brendan Caldwell, Caldwell Investment Management: Xylem, Vertiv, Qualcomm
Adam Johnson, Bullseye Brief: Celestica, Encompass Health
Michael Hakes, Murray Wealth Group: Mastercard, Prudential, LVMH